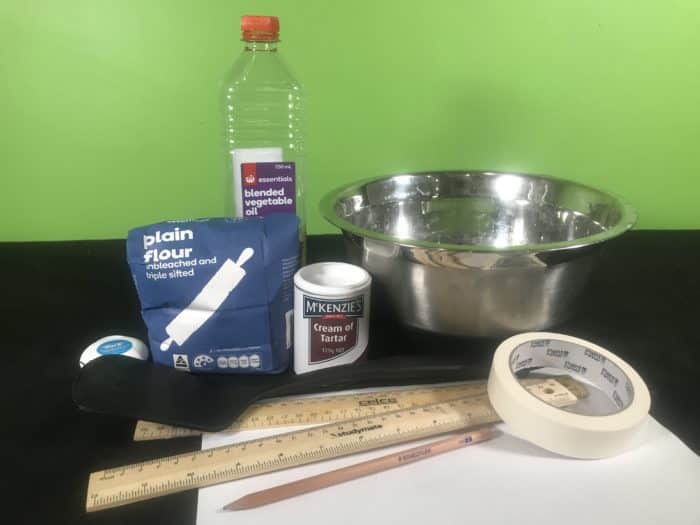
You will need:
To make the dough:
- 600g Flour
- 300mL water
- 100mL vegetable oil
- Two tablespoons of cream of tartar
- One teaspoon of salt
- Mixing bowl
- Spoon
For the Activity
- Dough
- Two rulers
- Toothpicks
- 30cm Dental floss
- Pencil
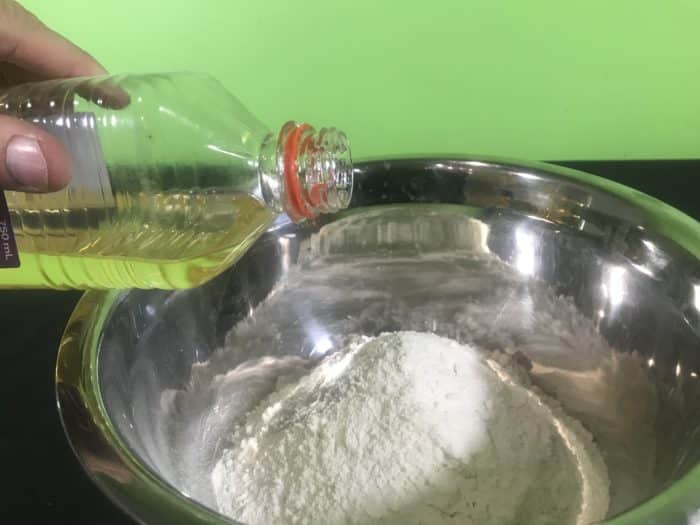
Create the dough in the bowl by mixing the ingredients together. Set to one side.

“Creating a simple map.”
You’ll need to make a simple map. Using a ruler, divide your A4 paper into quarters as shown above:

The pencil marks are going to act as simple latitude and longitude markers on your map.
Mark the top line as ‘North’, the right side ‘East’, the left side as ‘West’ and the bottom line as ‘South’.
Place the dough on the centre of the cross. The dough is now going to be your ‘mountain.’
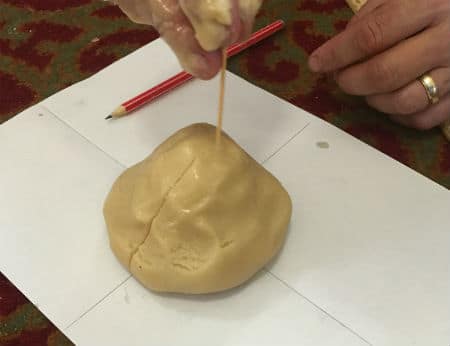
“Marking the dough for the topographic map.”
Using your toothpick, carefully draw two lines up and over the dough ‘mountain’. This will allow you to orient your ‘mountain’ each time you create a topographic slice of the terrain in the steps below.

Use the pencil to draw around the base of your ‘dough mountain’. This will create your first elevation on your map

Tie the dental floss at equal heights between the two rulers. This simple device will create your topographic slices in the next step.
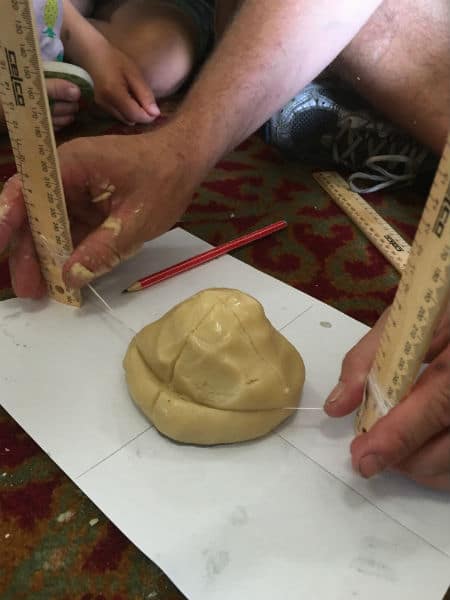
“Dividing the ‘dough mountain’ using the rulers and dental floss.”
Carefully place the rulers either side of your ‘dough mountain’. You should be able to slowly pull the rulers toward you so that the dental floss between the rulers cuts the dough evenly.

Carefully remove the top layer of your dough ‘mountain’ and discard the bottom part.

Place the top layer back onto the map centre, being sure to orient the lines you made with the toothpick as carefully as you can with your map’s latitude and longitude markers.

As before, use the pencil to draw around this new ‘dough mountain’ to create the next elevation on your topographic map.

Again, use your rulers and dental floss to cut another layer.

“Lines created on the topographic map; can you spot the elevation mistakes?”
Keep repeating until you run out of dough! You should get a simple, yet effective, topographic map of your dough ‘mountain’. Each line represents the increase in elevation and hopefully represents the shape of the dough ‘mountain’ at each elevation too! You might also see some mistakes in your map (e.g., squished dough creating warped lines or even the elevations crossing over).
Get the Unit of Work on Geology here!
- The Earth’s layers, the rock cycle, volcanoes, earthquakes & more!
From soil science to mineral testing, these hands-on experiments your students will discover the importance of natural resources and the role of plate tectonics in shaping our world.
Includes cross-curricular teaching ideas, student quizzes, a sample marking rubric, scope & sequences & more
![]()
School science visits since 2004!
– Curriculum-linked & award-winning incursions.
– Over 40 primary & high school programs to choose from.
– Designed by experienced educators.
– Over 2 million students reached.
– Face to face incursions & online programs available.
– Early learning centre visits too!
![]()
Online courses for teachers & parents
– Help students learn how science really works
![]()
Why Does This Happen:
The ability to read how steep hills and valleys are is critical when viewing a topographic map. Cartographers, people who create maps, use these lines to represent elevation in maps to show people how steep the terrain actually is. Think of these lines as imaginary segments of the Earth, whereby the lines represent how high or low a particular point of the map is compared to sea level.
The dough activity above simulates these segments that cartographers make of the Earth’s surface. Look at the map you have created. Notice how some lines are close together whereas others are further apart. If you repeat the activity above, but re-stack each segment as you go you might notice some patterns:
- The steep parts of your dough mountain show the lines being closer together.
- The less steep parts show lines being further spaced apart.
This is really handy, as effectively you can show cliffs as incredibly close lines squished together which stand out quite well on a two-dimensional map, really handy when planning your next bushwalking trip!
You can create your own topographic maps by surveying your local surroundings using an altimeter and tape, or alternatively a smartphone and Google Maps! Another way is to create a simple data set in Microsoft Excel to show students how the coordinates on a grid can create a three-dimensional mountain.


From the rock cycle to volcano formation, we’ve got your geology unit covered!
Get in touch with FizzicsEd to find out how we can work with your class.
![]()
Geology Rocks!
Years 1 to 6
Maximum 30 students
School workshop (NSW & VIC)
60 or 90 minutes
Online Class Available
Natural hazards & disasters
Years 1 to 6
Maximum 30 students
School workshop (NSW & VIC)
60 or 90 minutes
Online Class Available
STEM Full Day Accelerator - Primary
Designed from real classroom experiences, this modular day helps you create consistently effective science learning that directly address the new curriculum with easily accessible and cost-effective materials.


Comments