You will need:
- Spectrometer Template from UWM Chemistry
- Cardboard
- Scissors
- Glue or Sticky tape
- CD or DVD
- Optional: Box cutter
- Adult help
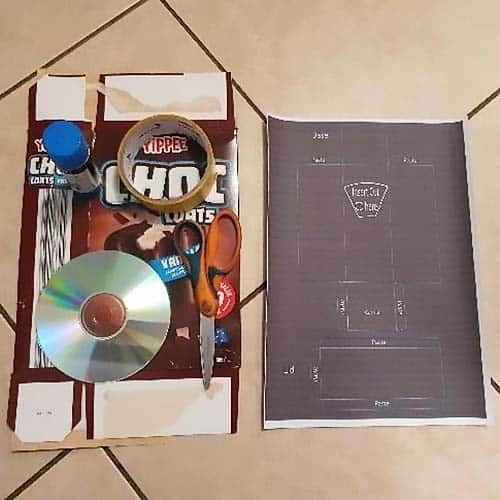

Print out the spectrometer template from UWM Chemistry. Using the glue, stick the template onto the cardboard.
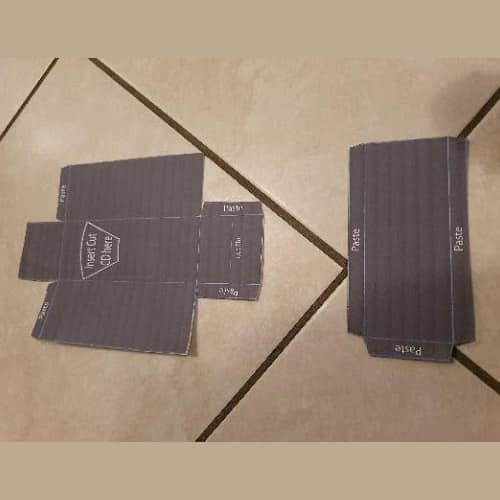
Cut the template out as shown in the image.

Get adult help for this step.
Cut the CD into the shape onto the template. Be careful when cutting the CD so that the reflective part does not peel off. Now glue down the CD onto the template where it says insert CD here.

Cut a thin slit where it says “cut slit” on the template using the scissors.
Optional: With an adult, you may find it easier to use a box cutter instead of scissors, but either works.

Fold on all the hard lines upwards as shown in the picture.

Fold the base into a box without the lid, you can either glue where it says “paste”, however we find that sticky tape is stronger.

Fold the lid and place it on top, ensure there is a gap left between the side closest to the CD, this will be the observation point to look through. Now tape or glue the sides together.
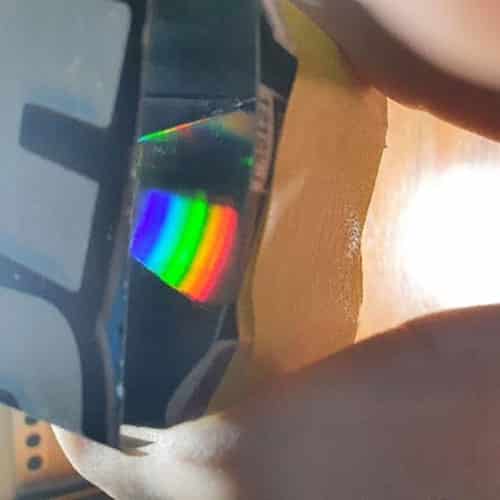
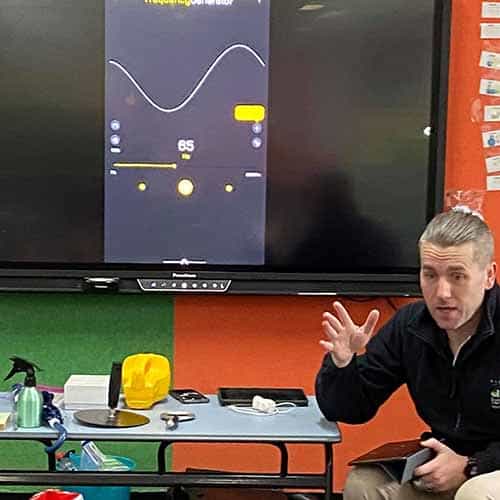
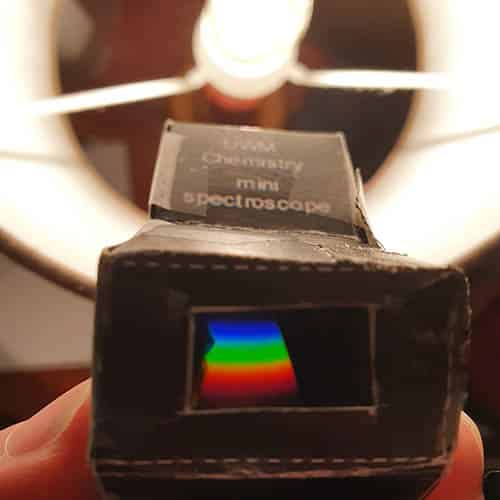
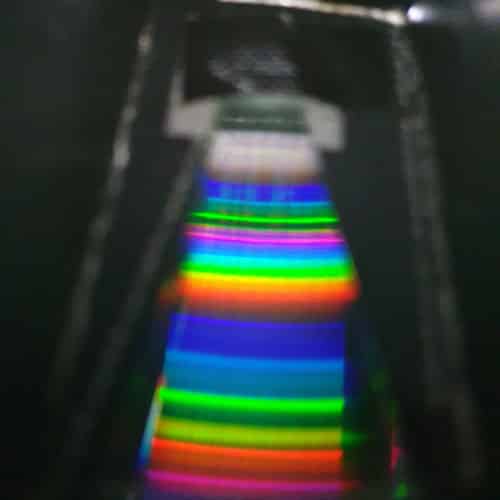
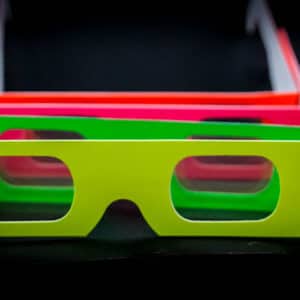
To test your spectrometer put the slit in front of a light and look through the gap you should be able to see a unique light pattern for different sources of light.
Danger – don’t look at the Sun!
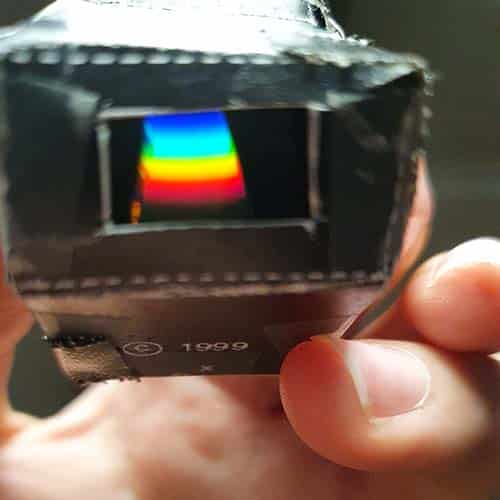
Look at different artificial light sources. This picture is from a 4000K LED light source.
Danger – don’t look at the Sun!
School science visits since 2004!
– Curriculum-linked & award-winning incursions.
– Over 40 primary & high school programs to choose from.
– Designed by experienced educators.
– Over 2 million students reached.
– Face to face incursions & online programs available.
– Early learning centre visits too!
![]()
Online courses for teachers & parents
– Help students learn how science really works
![]()
Get the Unit of Work on Light & Colour here!
- What is colour addition vs subtraction?
- What is opacity, translucence & transparency?
- What is the difference between refraction & reflection?
- Explore UV light, lenses, thermochromism and more!
Includes cross-curricular teaching ideas, student quizzes, a sample marking rubric, scope & sequences & more
![]()
What is going on?
A CD has tiny groves that are invisible to the eye. When light is shined on these groves the groves separate the light though reflections into the visible coloured spectrum. Using the spectrometer, the light enters through the slit and is separated into its colours which are viewed on the CD. These colours have important properties, they can determine the chemical composition of the source, the addition of colours, and show the surface temperature of the light.
The study of spectrometry goes all the way back to the 1600s, when Isaac Newton first discovered that light could be split into all the colours of the rainbow. Since then, we’ve found that different lights sources produce different patterns, depending on the nature of the light source and it’s temperature.
The table below shows how different sources of light have different intensities of colours.
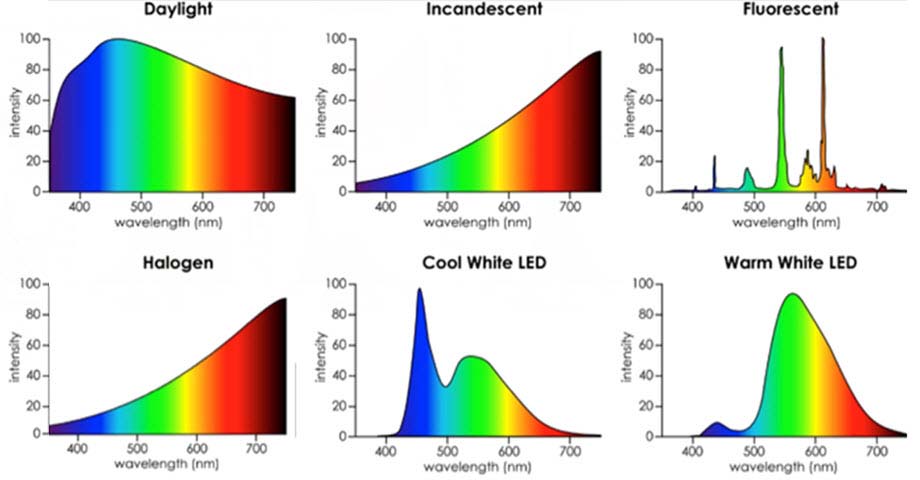
Source: https://physics.stackexchange.com/
Using this spectrometer on different light sources
Halogen spectral lines
6500k compact fluorescent lamp spectral lines
Applications
Astronomers use spectrometry to determine information when observing stars. Each element has its own unique spectral pattern. Astronomers can study the spectral pattern and determine a star’s element composition from looking at these colours. Astronomers can also determine the surface temperature, density, and rotational velocity using these patterns.
Learn more about spectrometry here
Variables to explore
- Explore a different range of light sources such as LEDs, fluorescent globes, candles, streetlights & old halogen globes
- Explore a range of different surface temperature globes.
- If you have a RGB smart globe explore what patterns you see for each colour.

Light & Colour
Years 1 to 6
Maximum 30 students
Workshop or Show (NSW & VIC)
60 or 90 minutes
Online Class Available
STEM Full Day Accelerator - Primary
Designed from real classroom experiences, this modular day helps you create consistently effective science learning that directly address the new curriculum with easily accessible and cost-effective materials.
...tick, tick BOOM!
Years 7 to 10
Maximum 240 students
Science show (NSW & VIC only)
60 minutes


Soo cool #makemorestuff
#scienceforlife
#LOL
#radicaledude!!!
#BOBFORLIFE
Glad you liked this!
The template in the link is nothing like whats in the pictures. The link’s template seems to be all one piece and the one in the pictures is two pieces. Very confusing.
Hi Wynn,
Thanks for commenting! The PDF template has been updated by the university which has caused the confusion (the above photos were from a different template). The good news is that the instructions for the other template are all on that sheet and are designed to be made without two separate pieces of paper. We’ll update our pictures soon. Much appreciated!