Animation rules!
Using science infographics in the classroom can be a quick way to get students to quickly visualise the ideas you’re putting forward. However, whilst a static image of science content is usually more than fine for the classroom, why not look further for some animated versions which grab the attention of the students and dive deeper into the detail? You don’t have to show a video, an animated infographic can very quickly get your point across without having to wade through several minutes of a science presentation. By hooking up your data projector or interactive whiteboard to your computer or students using their own device, you can quickly have students say ‘WOW’ whilst you guide them through what is being presented.
Below are short selections of the thousands of animated science infographics that you can find on the web… have fun!
Aluminium: How is it made?
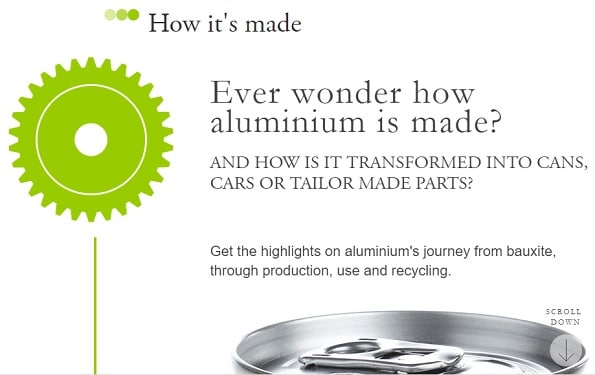
How Aluminium is made? Infographic by Hydro.com
This brilliantly animated infographic by Hydro.com traces the story of how Aluminium is made, from mining bauxite through to creating the final shelf product. Simply keep scrolling down and the information continues to be presented clearly and effectively. Very slick and highly useful if you’re teaching a geology unit in your school.
Flight videos deconstructed

Deconstructing the wing movements of a bat and more
The looping animated graphics in this infographic by Tabletop Whale are very handy if you’re running a class on flight. On this site, you’ll find the wing movements of a bat, dragonfly, duck, hummingbird and hawk moth. With colours placed in for the up and down stroke of the wings, your students can quickly compare the animals at a glance.
Cheetah: Nature’s speed machine
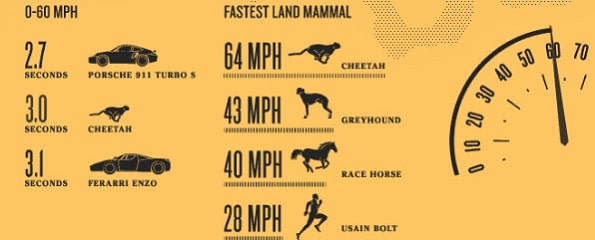
Cheetah’s speed and biology infographic by Animagraphs
Cheetah: Natures speed machine shows quickly covers key points in the biology of a cheetah in relation to how fast the animal can run. On this infographic, you’ll find an animation of the cheetah running plus comparisons on breathing rates, stride and more. Quite handy when teaching biology in your class! As you are presenting this as part of a science class you should consider getting the students to convert the units into the metric system.
How a 4 stroke engine works
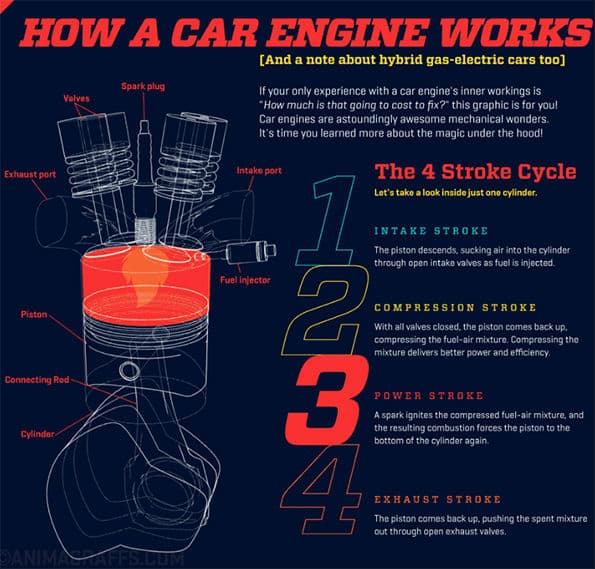
Showing the 4 stroke power cycle in an engine
Another infographic by Animagraffs, this time you can trace the cycles of a 4 stroke engine. This type of detail is where animated infographics come into their own element, making your life as a teacher easier!
Just how far is it to Mars?
![]()
Just how far away is Mars anyway?
Considering the recent announcements by SpaceX to get a private space mission to Mars, as well as the re-commitment of the current US administration to human exploration of the red planet, this scrolling infographic by David Paliwoda and Jesse Williams can provide a useful perspective on the sheer distance to students that needs to be overcome. Simple yet effective for a space science workshop!
How to build a human
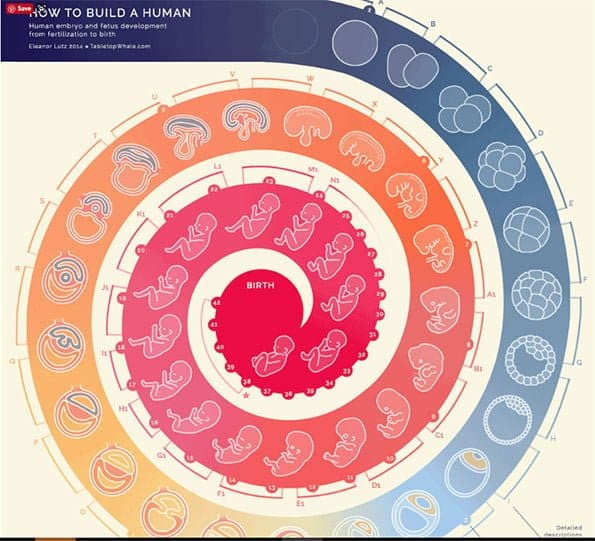
Rolling animated science infographic on the growth of an unborn baby
This amazing infographic by tabletopwhale.com almost seems like an infinite conveyor belt! This animated graphic charts the growth of an unborn child, starting from a single cell to blastula to fetus. Very handy for teaching the human body to students.
What is really warming the world?

Animated graph depicting factors contributing to global temperature rise
This animated graph by Bloomberg brings together climate models and observed data taken between 1880 to 2005 by NASA’s Goddard Institute for Space Studies showing greenhouse gases, ozone levels and land clearing. This will make a good class discussion about the use of graphs, correlations and causation when showing data (i.e. is there enough data to support conclusions given?). The depicted graph and associated data below the animation are compelling and well worth considering when planning a renewable energy teaching unit.
Animated USA wind map
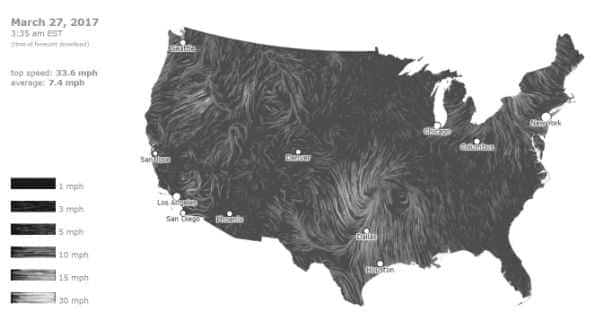
Almost real-time wind direction shown for the continental USA
Teaching a weather topic at school? This animated wind map of the USA could be interesting to overlay with a traditional synoptic chart to show the implications of high and low-pressure systems on wind speed and direction. You can also get an Australian version that’s live at earth.nullschool.net as shown below too (see the Cyclone Debbie off the east coast of QLD as at 27 March 2017 in the evening?).
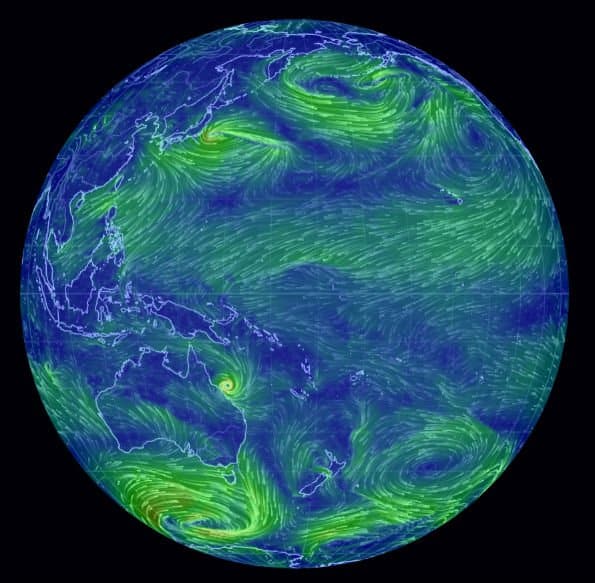
Wind map of Pacific Ocean at 27 March 2017
Simple Chlorella virus animation

A quick way to show symmetry in viruses.
Needing to show symmetry and structure of viruses in a microbiology workshop? This simple rotating animation by Eleanor Lutz will help students visualize the Chlorella virus in a rotating animation.
Want to create your own science infographics?
There are a number of free and paid online tools that you can use to quickly create science infographics to support your teaching. The following websites are ones we have used in the past if your favourite one isn’t listed feel free to pop these in the comments below!
Happy teaching,
Ben Newsome.

NEW Primary science teaching book!
“Be Amazing! How to teach science, the way primary kids love”
![]()
Want more ideas for teaching science?
Subscribe to the FizzicsEd Podcast!


Calendar of Events
HIGH SCHOOL Science@Home 4-Week Membership 12PM: March 2024
![]() Feb 26, 2024 - Mar 29, 2024
Feb 26, 2024 - Mar 29, 2024
![]() 12PM - 12PM
12PM - 12PM
Price: $50 - $900
PRIMARY Science@Home 4-Week Membership 2PM: March 2024
![]() Feb 26, 2024 - Mar 22, 2024
Feb 26, 2024 - Mar 22, 2024
![]() 2PM - 2PM
2PM - 2PM
Price: $50 - $900
Light and Colour Online Workshop, Jan 18 PM
![]() Jan 18, 2024
Jan 18, 2024
![]() 2PM - 3PM
2PM - 3PM
Price: $50
Light and Colour Online Workshop, Jan 18 AM
![]() Jan 18, 2024
Jan 18, 2024
![]() 9AM - 11AM
9AM - 11AM
Price: $50
Lego Robotics, Sydney Olympic Park Jan 2024
![]() Jan 24, 2024
Jan 24, 2024
![]() 9AM - 12PM
9AM - 12PM
Price: $50
Creative Coding, Sydney Olympic Park Jan 2024
![]() Jan 24, 2024
Jan 24, 2024
![]() 1PM - 4PM
1PM - 4PM
Price: $50
Creative Coding, Sydney Olympic Park July 11 2023
![]() Jul 11, 2023
Jul 11, 2023
![]() 9AM - 4PM
9AM - 4PM
Price: $100
Fizzics Education STEAM Day: Robots vs Dinosaurs, Lalor, Apr 14
![]() Apr 14, 2023
Apr 14, 2023
![]() 9AM - 12PM
9AM - 12PM
Price: $45 - $50
Creative Coding, Sydney Olympic Park April 14 2023
![]() Apr 14, 2023
Apr 14, 2023
![]() 9AM - 4PM
9AM - 4PM
Price: $100
Science@Home After School 4-Week Membership: March 2023
![]() Mar 06, 2023 - Mar 31, 2023
Mar 06, 2023 - Mar 31, 2023
![]() 4PM - 5PM
4PM - 5PM
Price: $40 - $1200
Featured Articles
Topics
- Biology [44]
- Events [46]
- National Science Week [3]
- Space Science [34]
- competitions [13]
- Sustainability [13]
- Student investigation [2]
- Social Emotional Learning [3]
- CAST test [1]
- Books [3]
- Farming [1]
- Outdoors [36]
- Sport [8]
- careers [11]
- UN SDGs [4]
- collaboration [1]
- Engineering [4]
- US Education [1]
- China [1]
- Food [5]
- Outreach [36]
- STEM [232]
- Physics [6]
- Global [2]
- K to 2 education [1]
- Virtual reality [2]
- citizen science [1]
- Churchill Fellowship [19]
- Gaming [8]
- Ozscied [2]
- Teaching [267]
- Chemistry [5]
- International [1]
- Photography [1]
- Play [1]
- numeracy [1]
- Cleveland [1]
- Gifted [7]
- Podcasts [119]
- Television [2]
- design thinking [8]
- Chinese student visits [1]
- Parenting [4]
- preservice teaching [5]
- Higher order thinking [1]
- Club [4]
- History [4]
- Pop Culture [4]
- Toys & Gadgets [1]
- project-based learning [5]
- Science & Technology Camps [1]
- Lesson ideas [1]
- Comedy [2]
- Philosophy [1]
- Coding [14]
- Indigenous [3]
- Preschool [24]
- Video Conferencing [40]
- family [2]
- Design [2]
- Lab Tech [1]
- math [1]
- Pakistan [1]
- Cooking [3]
- Kids [36]
- Remote Education [18]
- Virtual Excursions [9]
- Inclusive education [6]
- Oceans [6]
- Leadership [1]
- Electricity [1]
- Agritech [1]
- Dinosaurs [7]
- Kids Parties [5]
- Robotics [12]
- Edutech [26]
- Classroom management [1]
- video conference [1]
- special needs [1]
- scholarship [1]
- Botany [1]
- Apps [11]
- Distance Education [52]
- Kitchen Chemistry [7]
- Safety [2]
- Distance Learning [19]
- Student encouragement [2]
- online [5]
- image [1]
- Africa [1]
- English [1]
- Agriculture [5]
- Eastershow [2]
- Maker Space [11]
- Scicomm [141]
- primary education [46]
- STEAM [10]
- virtual [2]
- gamification [2]
- Asia Pacific [1]
- Art [17]
- Edchat [223]
- Maths [14]
- Scied [34]
- literacy [8]
- Higher education [4]
- Child online safety [1]
- Esports [1]
- Easter [1]
- Augmented Reality [4]
- Edtech [68]
- Media [18]
- Science [6]
- secondary education [45]
- teacher [1]
- dis [0]
- biotechnology [1]
- curriculum [2]
- AussieED [1]
- Education [216]
- Museums [31]
- Science News [4]
- Christmas [1]
- Vacation care [1]
- Film [1]
- computational thinking [2]
- high [1]
- Awards [14]
- Educhange [5]
- Music [3]
- Social Media [8]
- experiments [6]
- middle school [2]
- Inquiry-based learning [5]
- digital technologies [5]
- Earth science [2]
- Big History [1]
- Environment [39]
- NASA [6]
- Soils [1]
- seasonal [1]
- Artificial Intelligence [4]
- List [1]
- Games [1]
- Medicine [1]


Comments